By Scott Gaertner
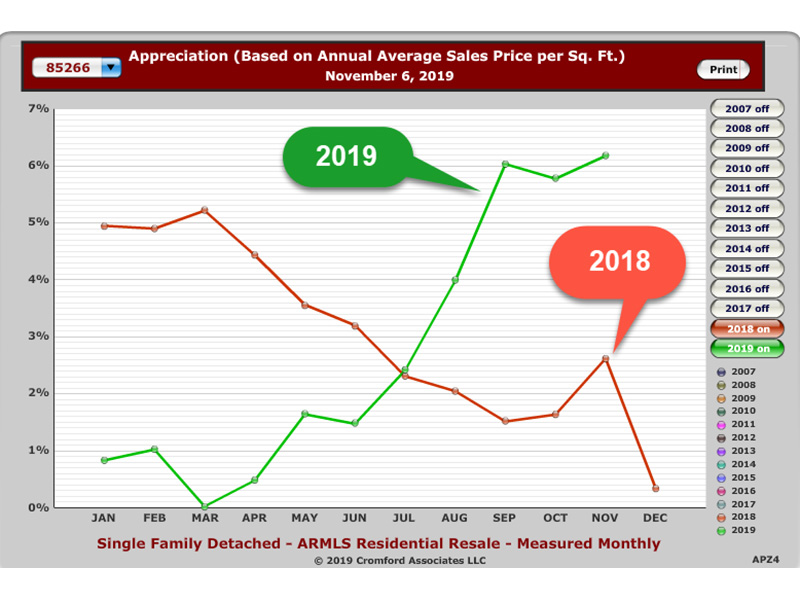
Loyal readers may remember that this time last year we were experiencing an almost unprecedented drop in demand. At the time I confessed to being baffled as to what might be the cause of the shift in buyer behavior but cautioned against overreaction by buyers and sellers. These types of market shifts can affect pricing; they can disappear just as quickly and inexplicably as they appeared. A year later, we now have a perfect graphical depiction of this phenomenon and what a difference a year can make. The chart shown is the average annual appreciation rates for the heart of Scottsdale North.
I think that is a perfect visual representation of where we are, and the trend for where we are headed at least in the near future. I would guess this chart brings up two questions:
How long will this last?
My crystal ball is no better than yours but while December can be a quiet month, the first two quarters of the year are historically Scottsdale North’s best. Combine that with high tax states continuing to have tax and other issues, and I would guess that this will continue at least through the first quarter.
Is this A Bubble?
Michael Orr of the Cromford Report is the valleys guru on real estate statistics. He is an Oxford-trained mathematician who has compiled our statistics for many years, and he says:
“Higher prices should encourage more sellers and discourages buyers which will eventually have a balancing effect on the market. If you ever see that higher prices encourage buyers to buy more, that’s when you have a bubble developing. This is what happened in 2004 and early 2005, but it is not happening now.”
I completely agree because these sales are real money. For those who like a more in-depth analysis of pricing, Michael’s associate has this to say:
“However, there is far too much attention paid to short-term influences and fluctuations these days and not enough attention paid to the long view. Real estate is a long-term investment for many people. Despite the euphoria of 2005-2007 and the nightmare of 2008-2011, on average homes are selling 81.6% higher today than they were in the year 2000. That’s an average appreciation rate of 4.3% per year over the course of 19 years. Smaller homes appreciated the most overtime while larger homes appreciated the least. Homes under 1,000 sf have appreciated 122% since 2000, an average of 6.4% per year. Those between 1,000-2,000 sf appreciated 106%, an average of 5.6% per year. 2,000-3,000 sf appreciated 68% at 3.6% per year. 3,000-4,000 sf appreciated 49% at 2.6% per year and homes over 4,000 sf appreciated 11% at 0.6% per year.”
This should give both buyers and sellers directions on how to proceed moving forward, but if not, give me a call. We will follow the numbers and keep you posted as they unveil.
We thank you for allowing us to assist you with your real estate needs in 2019. We consider it our duty to advise and inform our clients – whether that means buying, selling, or staying put. We wish you and those you love a very happy Holiday season. Here’s to a terrific 2020!
Scott Gaertner is an Associate Broker with Keller Williams Northeast Realty, who for the past 25+ years has helped more people to find their lifestyle niche in the Scottsdale North area than anyone else.
